

1·
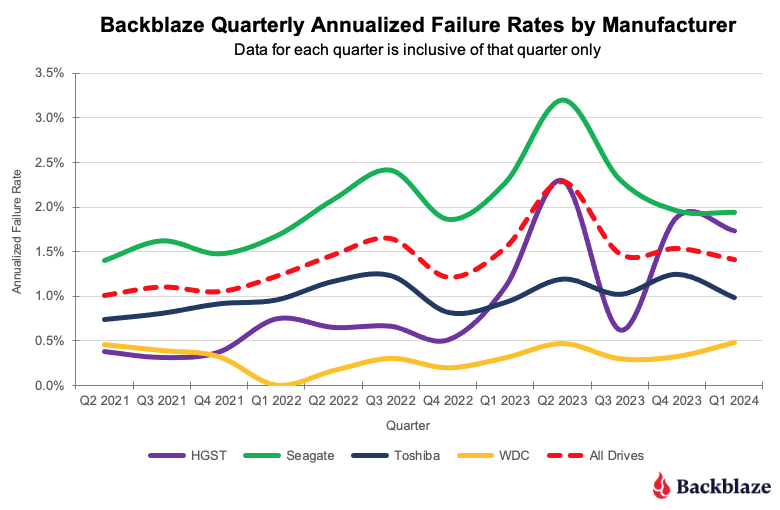
16 hours agoAFR is a percentage, 1 drive from a pool of 10 means 10%, 5 drives from 100 means 5%; so with regards to your point that they don’t have much WD drives, if they don’t have much WD, then each fail is even more detrimental on the chart, therefore making the data even more impactful. The data also showed the average across all manufactures and you can see clearly Seagate being consistently above the average quarter over quarter. The failure rate is annualized, so age of drive is also factored into the consideration.
When there’s a clear trend of higher failure rate represented as a percentage, I’m not going to volunteer my data, NAS or otherwise, as tribute to brand loyalty from a manufacture that’s gone downhill from the decades past.
It is pretty clear that you have less of an inclination against Seagate than my experience dictates me to. Stats can be twisted to tell anything, and my twist on what I’m seeing tells me to steer away from Seagate; your interpretation can most certainly differ.